On this page
Building a map that makes D.C. worth exploring
How camera movement, independent data layers, and saved discoveries turned a browser map into a place to wander.
I live in D.C. and love exploring it. A route between two addresses is useful, but it does not capture the feeling of wandering through museums, parks, and neighborhoods.
DCmap grew out of that difference. I wanted to make a browser map that invited people to look around, discover a place, and keep moving because they were curious.
Let the map do the rendering
The implementation uses Next.js, React, TypeScript, and Mapbox GL JS. Mapbox owns the map, building extrusions, terrain, and camera. React owns the controls and the state that connects the map to exploration.
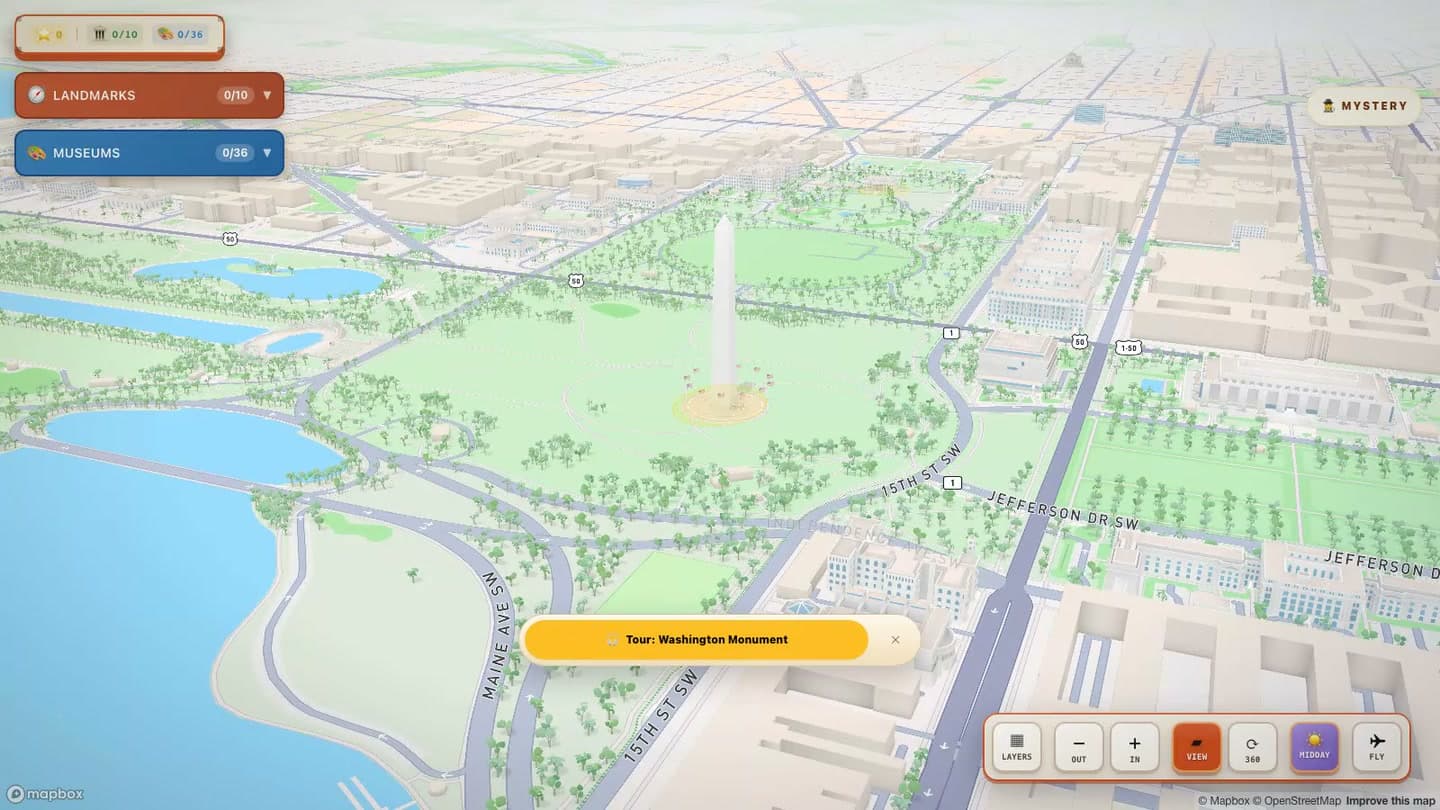
The StateManager coordinates map state, game state, landmark tracking, museum progress, and fly controls through hooks and providers. Discoveries, levels, and achievements persist in localStorage.
Movement changes the experience
Fly mode uses keyboard input and mouse look to move through the city. The controller converts movement into longitude and latitude changes relative to the current bearing. It moves a free camera at a real altitude in meters and checks building footprints four times a second so the camera clears rooftops instead of flying through them.
The controller uses an animation-frame loop, with elapsed time in its movement calculations. Landmark checks run periodically rather than on every animation frame. That separates smooth movement from the less frequent work of checking nearby places.
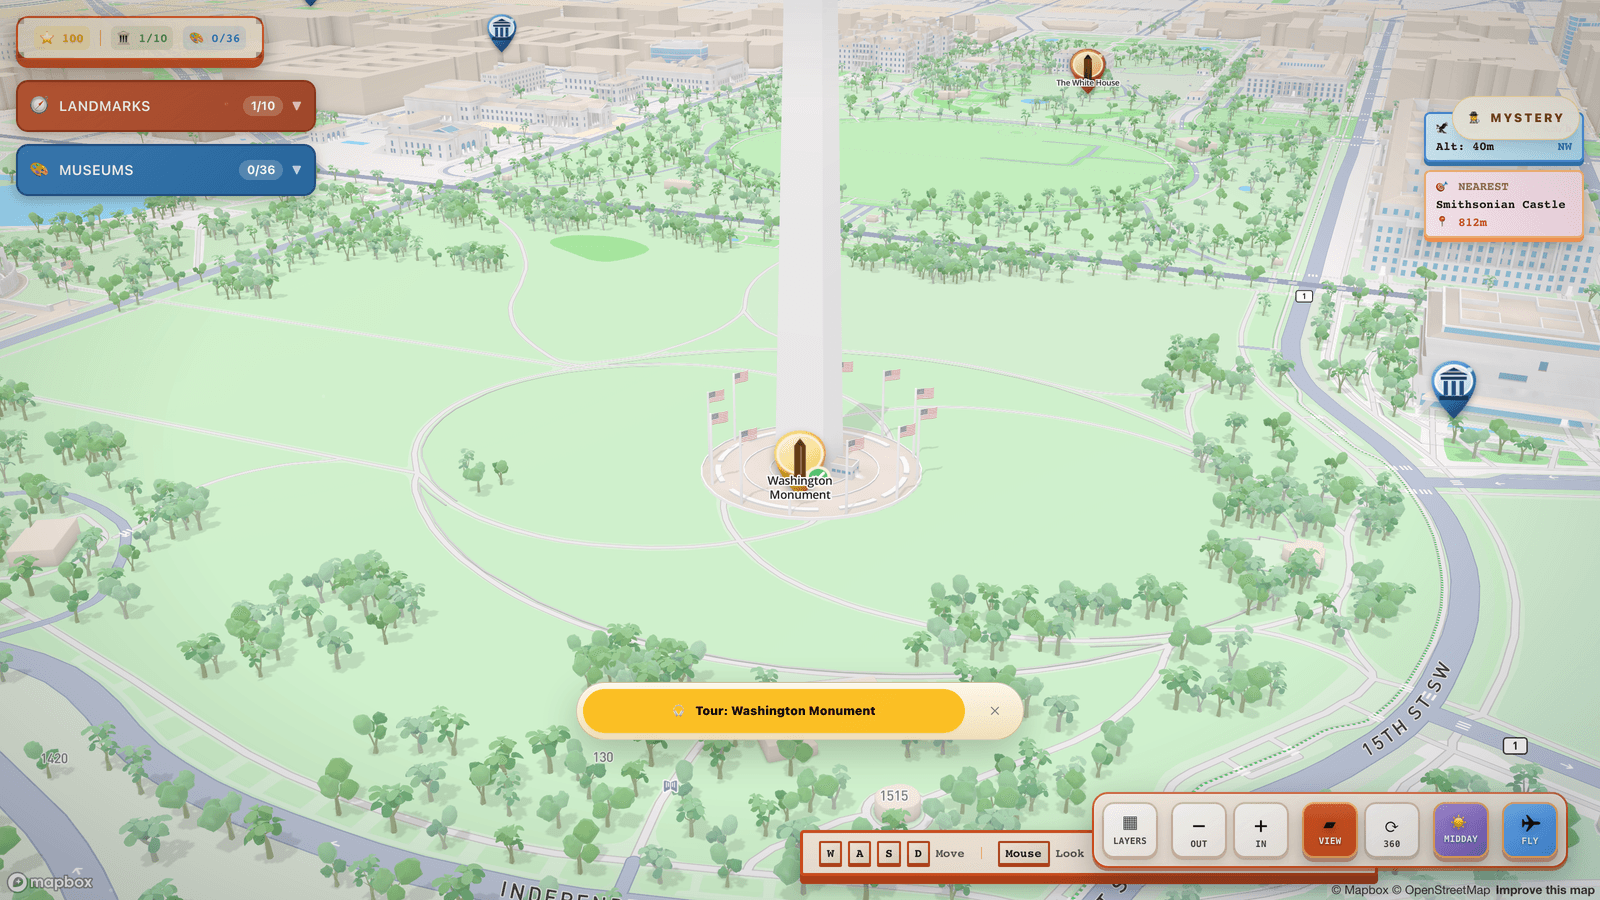
The feeling I was after was responsive movement with enough momentum to avoid a nervous camera. Making movement feel right was more useful than giving it an impressive physics label.
A city made of separate layers
The data layer includes curated landmarks, museum locations, a tree inventory, roads, and a navigation graph generated from road data. The walk-graph preprocessing uses Turf.js. Runtime proximity checks use a small Haversine calculation.
Independent layer toggles let a reader choose what to explore. A museum trip and a walk through green space need different information. I wanted a small card with a name, context, and a way to learn more, rather than a panel that covered the place being described.
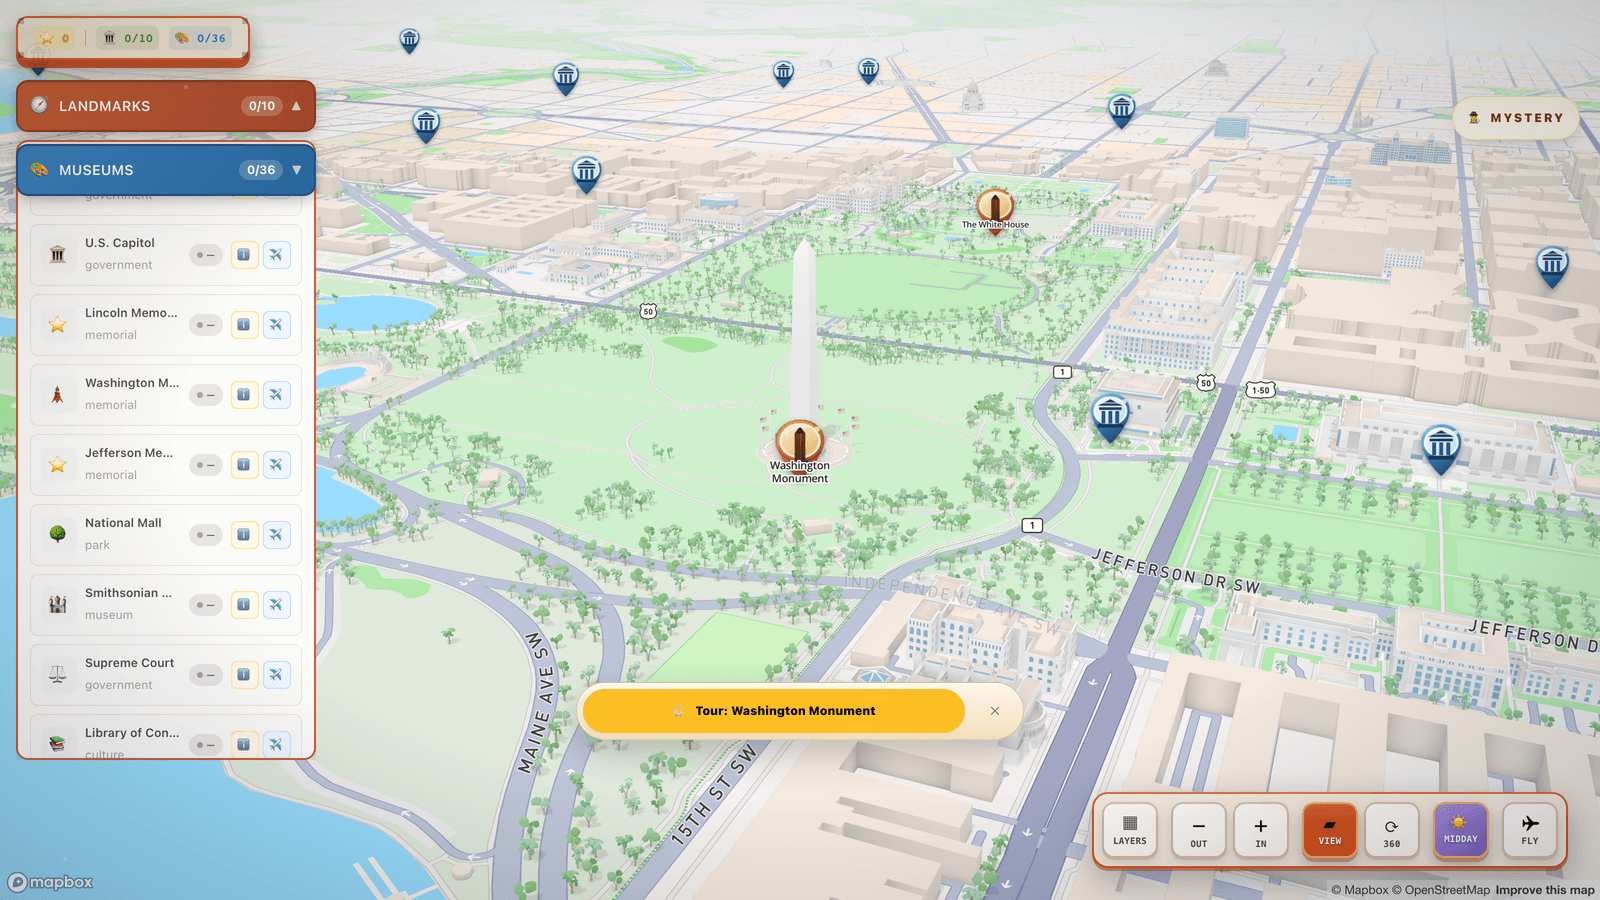
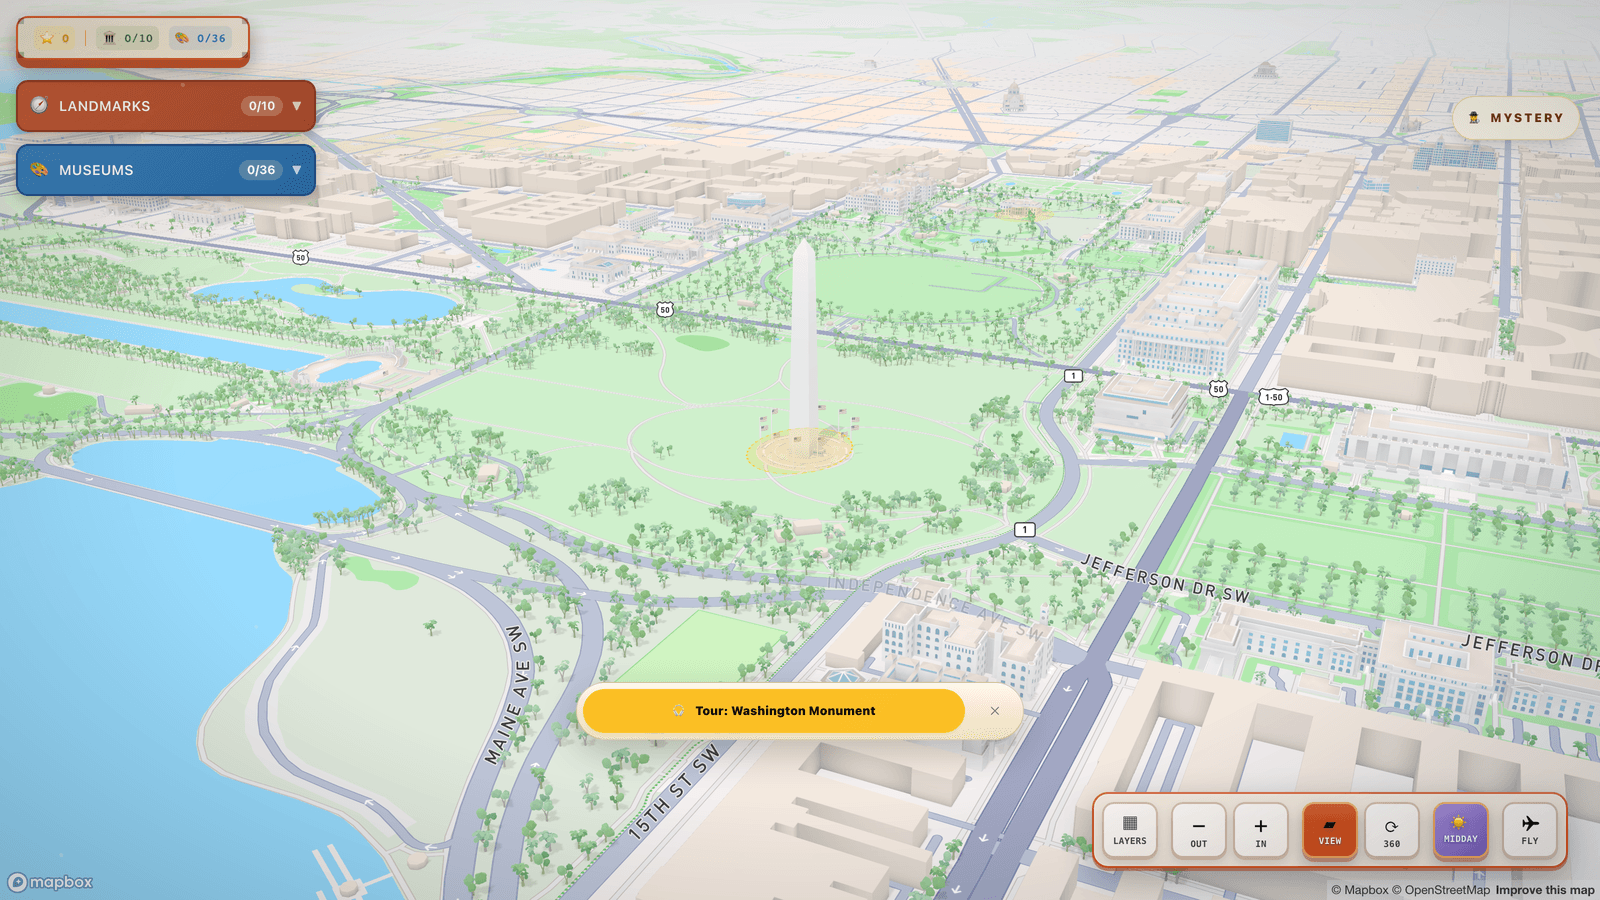
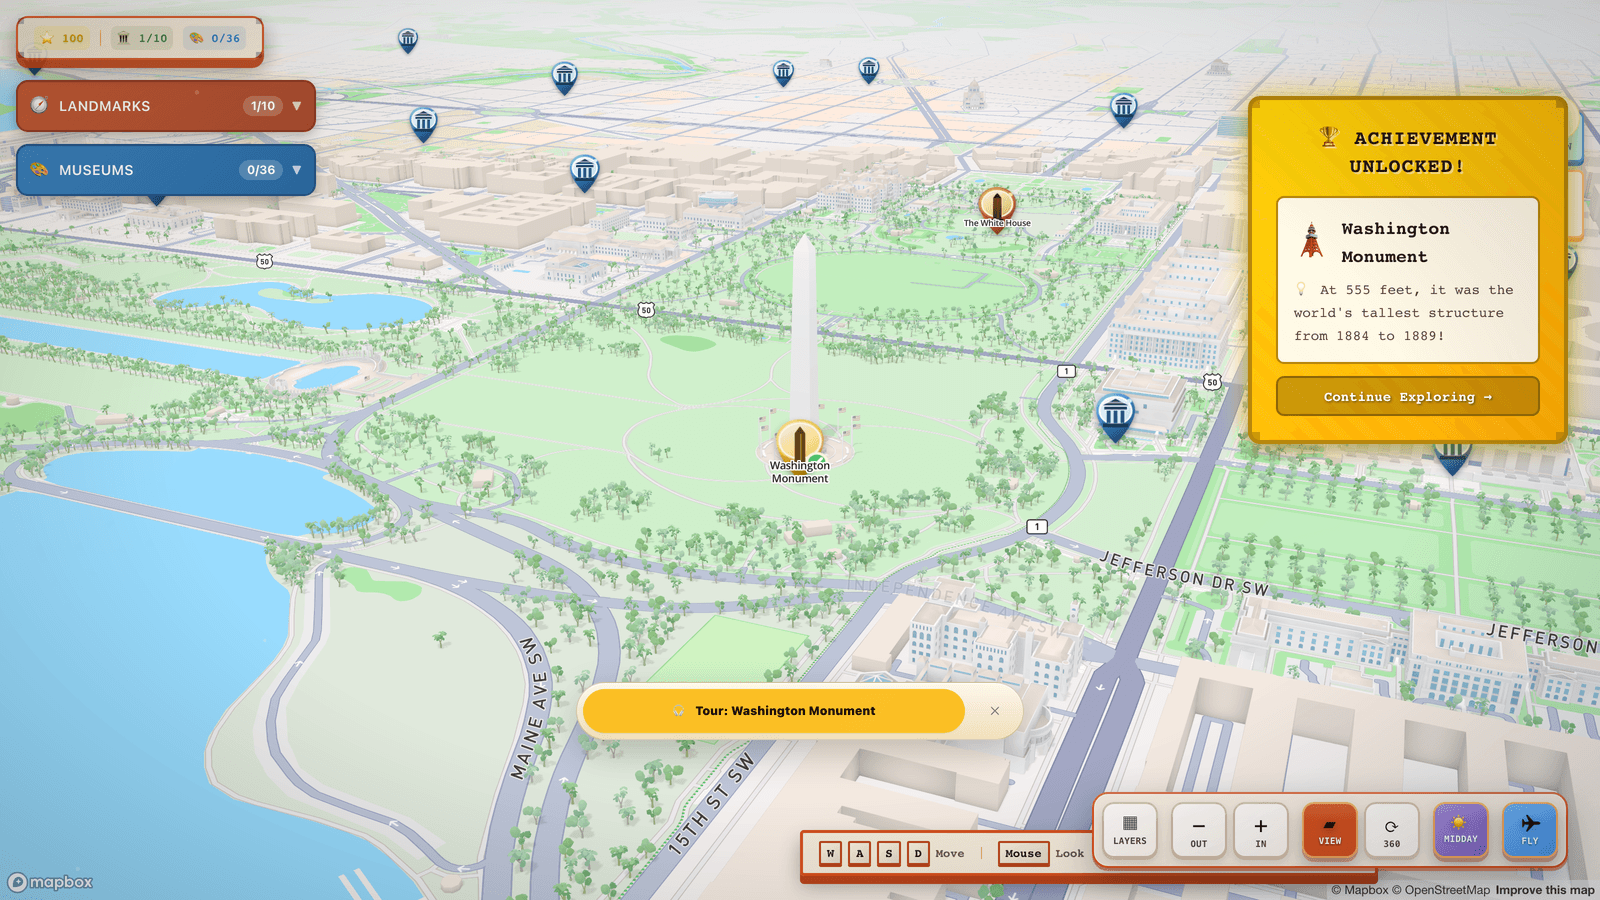
Discovery and saved progress give people a reason to move toward a place instead of only clicking its name. Because that progress is saved in the browser, a second visit picks up where the first left off.
What I would measure next
The project has more to prove about mobile controls, keyboard accessibility, and performance on different devices. A frame-rate claim needs a named device, browser, scene, and measurement method. I would profile those conditions before promising a consistent 60 FPS.
The lesson I would reuse is the boundary between infrastructure and experience. Mapbox supplies geographic rendering; the decisions around movement, information, and discovery determine how that geography feels to someone using it.
Explore DCmap or read the project case study.